written by

Subscribe to our monthly water newsletter
We might send you an email if we have something news worthy, written by our water professionals
1. What Is Gas Transfer Efficiency?
Gas Transfer Efficiency (GTE) describes how much of an injected gas actually dissolves into the water compared to how much gas is supplied.
Simple definition:
GTE (%) = (Gas dissolved in water ÷ Gas injected) × 100
If you inject 100 units of oxygen and only 15 units dissolve, your GTE is 15%. The remaining 85% is lost to the atmosphere.
Why GTE matters
Low GTE means:
Higher energy consumption
Higher gas consumption
Lower dissolved oxygen stability
Inconsistent biological results
High GTE means:
Lower operating costs
Faster oxygen delivery
Stable DO levels
Improved biological efficiency
2. What Controls Gas Transfer Efficiency?
Gas transfer efficiency is governed by physical and chemical laws, not marketing claims. The key drivers are:
1. Bubble size
Smaller bubbles = higher surface area per unit of gas
2. Bubble residence time
The longer a bubble stays in water, the more gas can dissolve
3. Gas–liquid interface stability
Stable interfaces allow diffusion instead of rapid escape
4. Pressure and solubility
Higher pressure increases gas solubility (Henry’s Law)
5. Water chemistry and temperature
Warmer water holds less gas; biofilms reduce transfer efficiency
3. Gas Transfer vs Oxygen Transfer Efficiency (OTE)
You may also encounter Oxygen Transfer Efficiency (OTE), a specific case of GTE used in aeration and wastewater.
GTE → applies to any gas (oxygen, ozone, CO₂, nitrogen)
OTE → specific to oxygen systems
The underlying physics is the same.
4. Comparison of Common Oxygenation Technologies
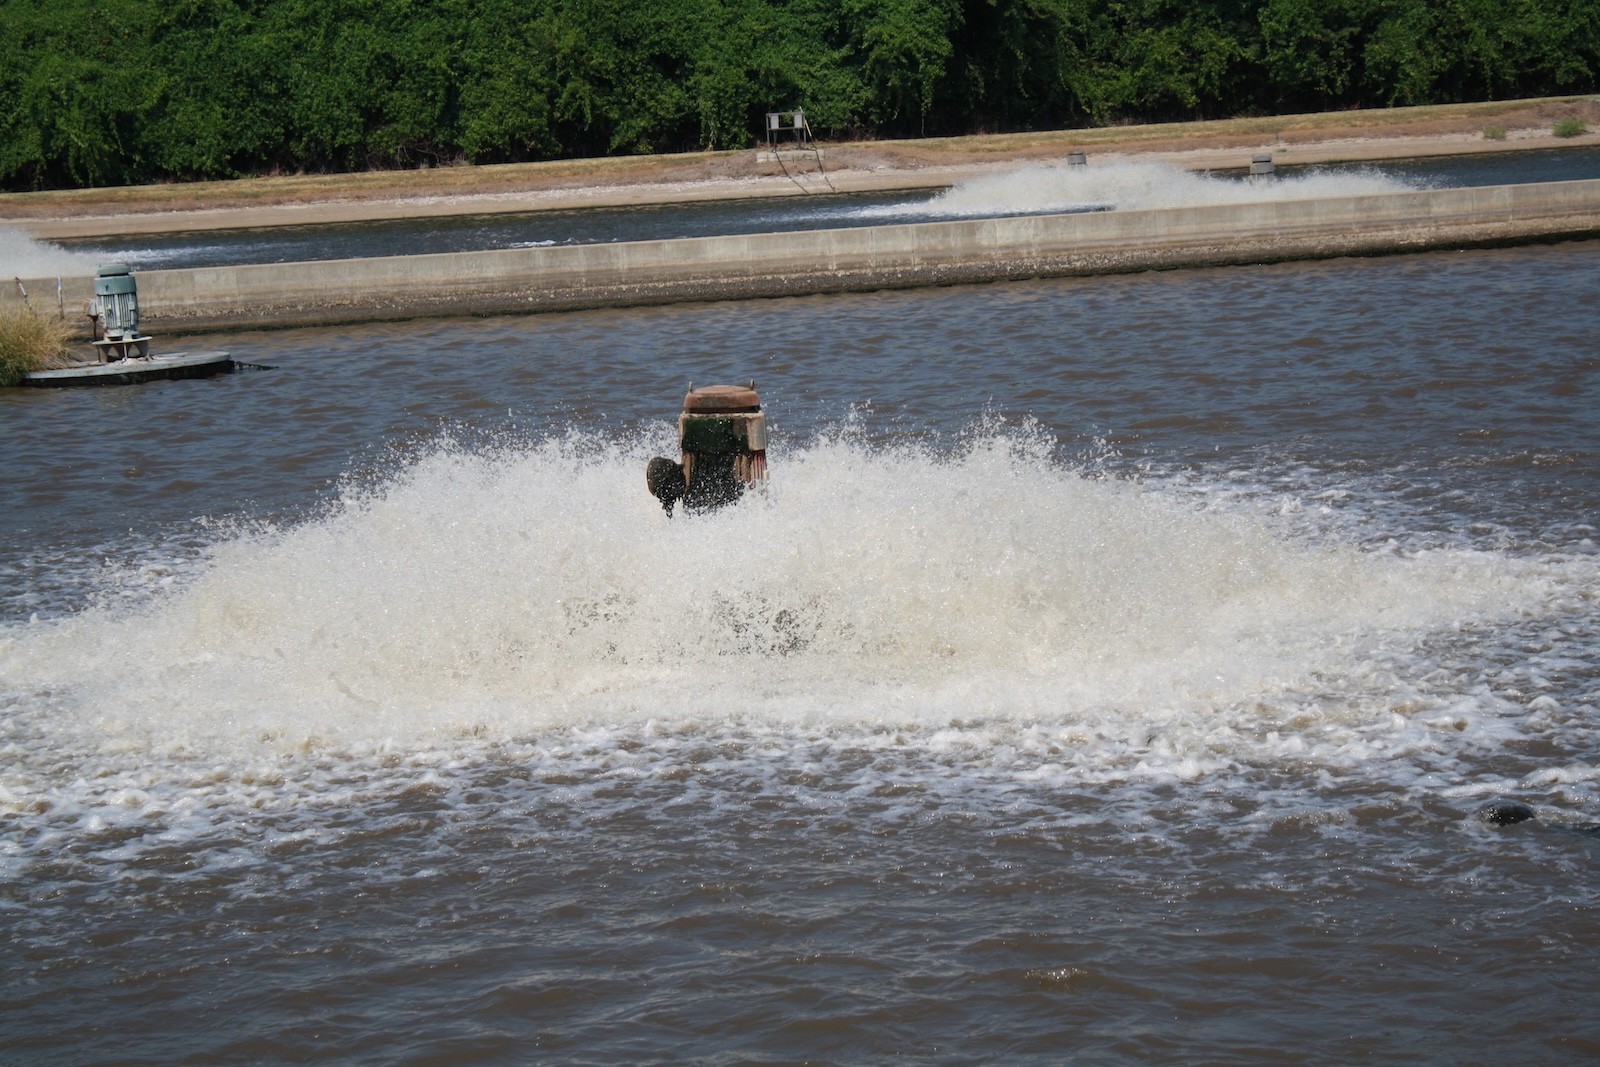
4.1 Surface Aerators
How they work:
Agitate water surface to pull air into water
Typical GTE:
🔻 2–5%
Limitations:
Extremely poor gas transfer
High energy consumption
Oxygen escapes almost instantly
Creates turbulence but not stable DO
Best suited for:
Emergency aeration, not precision oxygen control
4.2 Coarse Bubble Diffusers
How they work:
Large bubbles (>3–5 mm) released from the bottom
Typical GTE:
🔻 5–10%
Limitations:
Large bubbles rise fast
Very short contact time
Most gas escapes unused
Common mistake:
Assuming “more bubbles” = more oxygen (it doesn’t)
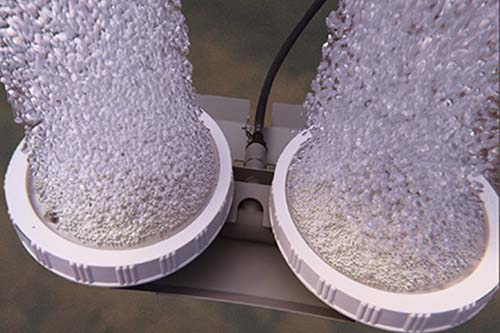
4.3 Fine Bubble Diffusers
How they work:
Smaller bubbles (0.5–2 mm) increase surface area
Typical GTE:
⚠️ 15–30%
Limitations:
Still buoyant — bubbles rise
Membranes clog over time
Performance degrades with biofilm
Industry reality:
Often marketed as “high efficiency,” but still loses most oxygen.
4.4 Venturi Injectors
How they work:
Use pressure drop to pull gas into flowing water
Typical GTE:
⚠️ 10–25%
Limitations:
Requires high pump energy
Gas bubbles still form and escape
Efficiency highly flow-dependent
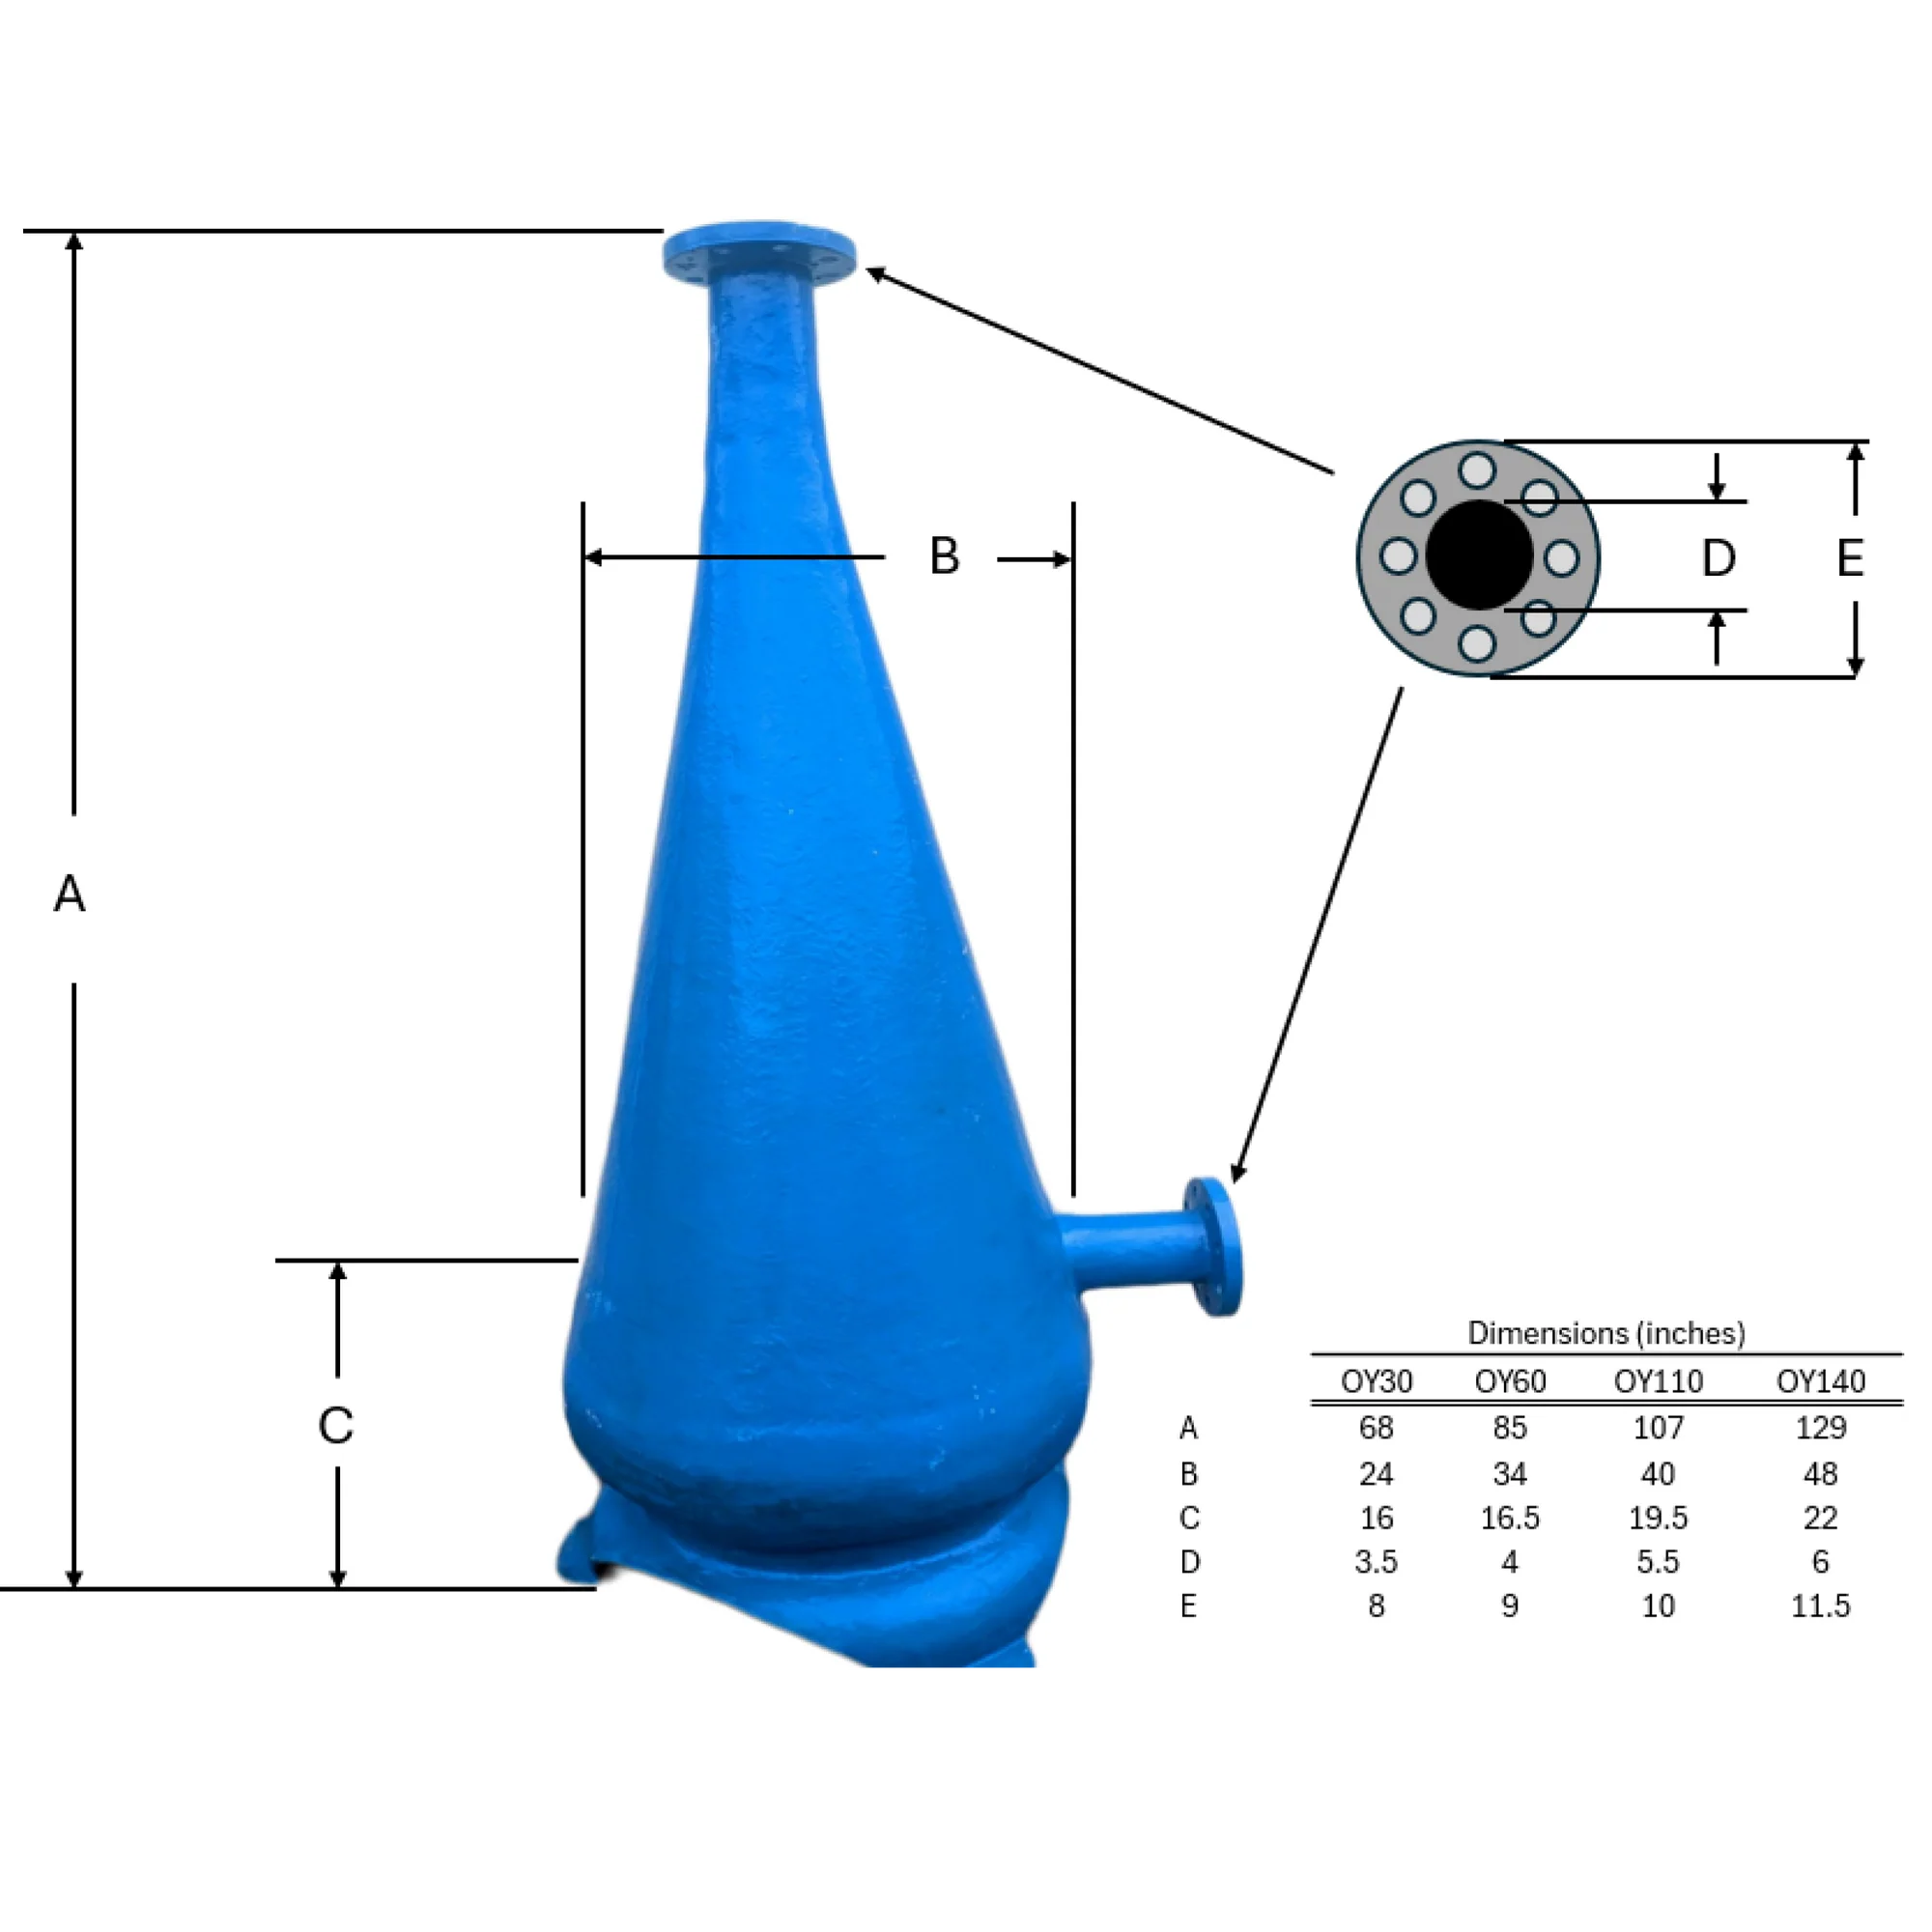
4.5 Pressurized Oxygen Cones / Saturators
How they work:
Dissolve gas under pressure before releasing water
Typical GTE:
✅ 60–90%
Limitations:
High CAPEX
Large footprint
Complex operation
Mainly suitable for large industrial facilities
Strength:
High dissolution — but limited scalability and flexibility.
4.6 Nanobubble Technology
How it works:
Generates ultra-fine gas bubbles (<200 nm) that:
Do not rise
Remain suspended for days
Dissolve gas via diffusion, not buoyancy
Typical GTE:
✅ 80–95% (often approaching theoretical maximum)
Why nanobubbles are different (not just “smaller bubbles”)
Nanobubbles:
Have near-zero buoyancy
Possess electrostatic surface charge
Create extremely high gas–liquid interfacial area
Remain stable long enough for full gas dissolution
This shifts oxygenation from:
“bubbles rising and escaping”
to
“gas stored and released inside the water itself”
5. Why GTE Above 100% Saturation Is Possible
Traditional systems aim for 100% DO saturation because excess oxygen escapes as bubbles.
Nanobubbles allow:
200–400% DO saturation
Without visible bubbling
Without rapid off-gassing
We suggest checking out our article about this.
This is critical in:
Hydroponics
Aquaculture
Irrigation reservoirs
Livestock drinking water
Ozone disinfection
6. Energy Efficiency: The Hidden Cost of Low GTE
Low GTE systems compensate by:
Increasing airflow
Increasing pressure
Increasing runtime
Result:
High electricity bills
Equipment wear
Marginal DO improvement
Nanobubble systems achieve higher DO with less gas and less energy, because almost every molecule injected is actually used.
7. Summary Comparison Table
Technology | Typical GTE | Bubble Behavior | Stability | Overall Efficiency |
|---|---|---|---|---|
Surface aerator | 2–5% | Large, instant escape | None | ❌ Very low |
Coarse bubbles | 5–10% | Fast-rising | Low | ❌ Low |
Fine bubbles | 15–30% | Rising | Medium | ⚠️ Moderate |
Venturi | 10–25% | Rising | Medium | ⚠️ Moderate |
Oxygen cone | 60–90% | Dissolved under pressure | High | ✅ High |
Nanobubbles | 80–95% | Non-rising | Very high | ✅ Excellent |
8. Key Takeaway
Gas transfer efficiency is not about how much gas you inject —
it’s about how much stays in the water and does useful work.


